Assessing price movement potential in trading in Hindi with support resistance and a market scanner versus pure chart reading
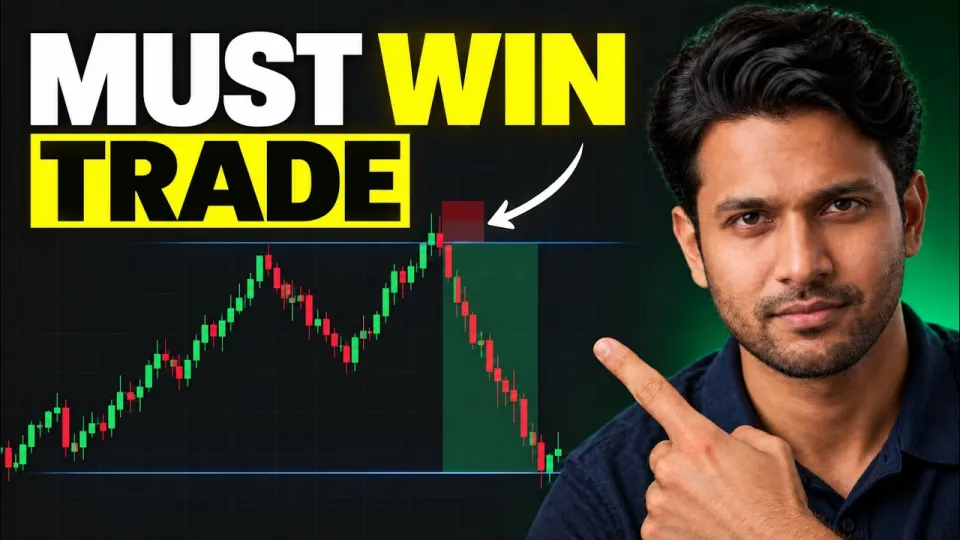
Video: Trading Mein Price Movement Ka Potential Kaise Assess Kare? | Trading in Hindi
· based on the channel Trader Smoke FX
Assessing the potential of a price movement means deciding, before you enter, how far price can realistically travel and what would invalidate the idea. In practice this comes down to three checks done in order: mark support and resistance zones on a lower timeframe, confirm the setup with volume and a scanner signal, then size the trade so a fake breakout costs you little. A free Telegram community with forecasts and scanner output is available here: join the free trading community.
Why potential matters more than the entry signal itself
A signal tells you direction; potential tells you whether the trade is worth taking. Two setups can point the same way, but if the first has 40 pips of clear space to the next zone and the second has 8 pips before resistance, only one of them pays for its risk. Traders who skip this step tend to collect many small wins and then give them back on a single trade where price had nowhere to go.
Potential is measured, not felt. The practical inputs are the distance to the nearest opposing zone, the strength of that zone (how many times it was tested and how price left it), the presence of volume behind the move, and the time of day. A move that starts in a quiet session with thin volume has less follow-through than the same candle shape during an active session.
Step 1: mark support and resistance zones on the 5-minute chart
Zones are drawn before the market gives a signal, so the decision is mechanical rather than emotional. On a 5-minute chart, mark areas where price reversed at least twice, and treat them as bands rather than single lines, because wicks routinely overshoot a precise level.
- Open the 5-minute chart of the pair you intend to trade.
- Mark the most recent swing highs and swing lows that produced visible reactions.
- Group repeated touches into one zone instead of drawing several lines a few pips apart.
- Note which side price left the zone from and how fast — a fast departure suggests real interest, a slow drift suggests exhaustion.
- Keep only the two or three zones closest to current price; older levels far away do not affect the next hour of trading.
Once the zones exist, the question "how much room is there?" has a numeric answer: the distance from your entry to the first opposing zone. If that distance is smaller than your stop loss, the trade has negative potential and should be skipped regardless of how good the candle looks.
Step 2: use a market scanner to shortlist setups
A market scanner replaces manual scrolling through dozens of pairs with a filtered list. Instead of staring at charts hoping to notice something, you set conditions — a zone touch, a momentum shift, a volume spike — and the scanner returns the instruments that currently meet them. This is where PUT and CALL candidates come from in a typical intraday workflow.
Two rules keep scanner use honest. First, the scanner proposes, the chart decides: a signal that fires in the middle of nowhere, far from any marked zone, is usually noise. Second, a scanner is only as good as its filters, so review which conditions produced the last batch of signals and drop the ones that consistently fire late. Used this way, a scanner is a time-saving tool for assessing potential across many markets, not a replacement for the zone work in step one.
Step 3: read impulse and manage the trade after entry
An impulse is a fast, one-directional move with little overlap between consecutive candles, and it is the clearest evidence that buyers or sellers are committed. Entering on the pullback after an impulse, rather than chasing the impulse itself, keeps the stop tight and the potential wide.
Trade management follows the same logic as the entry. Move the stop to break-even only after price clears the first obstacle, not immediately after entry, because early stop adjustments convert a good idea into a random exit. Take partial profit at the nearest zone if the remaining distance to the next one is small. On cross pairs such as AUD/CAD, spreads and session liquidity matter more than on majors, so the potential must be noticeably larger to justify the same risk.
Step 4: treat fake breakouts as a normal cost of doing business
A fake breakout is a move through a level that fails to hold and closes back inside the range. It is not a rare anomaly; it is one of the most common events around obvious levels, precisely because stops cluster there. The defence is structural, not predictive.
- Wait for a candle close beyond the zone instead of entering on the first touch.
- Place stops beyond the zone plus a buffer, not exactly at the level.
- Reduce size when the target zone has been tested many times, since the odds of a false break rise.
- After a fake breakout, the failed direction often becomes the real one — a break above a range that fails can set up a move down.
Accepting that some breakouts will fail is what makes the potential calculation meaningful: you are not trying to be right every time, only to ensure that the winners are larger than the losers.
Typical questions traders raise about this workflow
The most frequent doubt is whether the same idea works when market conditions change. It does, but the parameters change with it: in a trending session, zones give way more easily and pullback entries outperform counter-trend fades, while in a range the opposite holds. This is why the zone marking comes first and the signal second — the same signal carries different potential in different conditions.
The second recurring question is about timeframes. A 5-minute chart is a working tool for intraday decisions, but the levels it shows should be checked against a higher timeframe; a 5-minute support that sits in the middle of a daily range is far weaker than one aligned with a daily level. The third is about automation: a scanner or AI tool can shortlist candidates and save time, but position sizing and the final entry decision remain manual, because they depend on context no filter captures fully.
Tools and links mentioned in the breakdown
- Free Telegram community with forecasts, scanner output and setup reviews: https://t.me/+26zZkOJe9-w0Yzli
- Broker used for trading and free registration: https://bdclick.app/smart/ind
Summary
Price movement potential is assessed in a fixed order: zones first, scanner signal second, impulse confirmation third, and a stop placed so that a fake breakout is survivable. The 5-minute chart provides the levels, volume and momentum provide the conviction, and the distance to the next opposing zone provides the number that decides whether the trade is worth its risk. This breakdown was produced by the Trader Smoke FX channel, which covers support and resistance, scanner-based PUT and CALL entries, crypto forecasts and cross-pair setups such as AUD/CAD and AUD/JPY. Everything described is educational and carries real risk of loss, and past results do not guarantee future ones. To follow the setups and forecasts as they are published, join the free Telegram community.
Key takeaways
- Zones are marked on the 5-minute chart before any entry decision is taken.
- A market scanner is used to generate PUT and CALL signals instead of scanning dozens of pairs manually.
- Impulse and AUD/CAD CALL trades are managed with defined entries, not held open-ended.
- Fake breakouts are treated as a separate risk case that invalidates a level-based entry.
- The breakdown is educational only and past results do not guarantee future ones.
Questions & answers
How do I know a price move has enough potential before entering?
Compare the distance from your entry to the first opposing support or resistance zone with your stop loss distance. If the room to the zone is smaller than the risk you are taking, the trade has negative potential and should be skipped. Volume behind the move and the activity of the session are secondary confirmations.
Does the same setup work in different market conditions?
The structure stays the same but the behaviour of levels changes. In a trend, zones break more easily and pullback entries work better, while in a range, reactions at the edges are more reliable. That is why zones are marked before any signal is taken, since the same signal has different potential in each condition.
Can a market scanner replace manual chart analysis?
No. A scanner shortlists instruments that meet predefined conditions, which saves time across many pairs, but the final decision still requires checking whether the signal fired near a meaningful zone. Signals in the middle of nowhere are usually noise.
Why do breakouts fail so often around obvious levels?
Stops tend to cluster just beyond visible highs and lows, so price is often pushed through a level to reach that liquidity before reversing. Waiting for a candle close beyond the zone and placing the stop with a buffer reduces the damage from these fake breakouts.
Source: Trading Mein Price Movement Ka Potential Kaise Assess Kare? | Trading in Hindi · Markdown version